highlighted projects
Avian Flu ML Project - Python
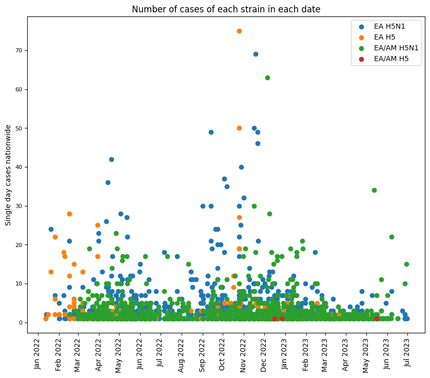
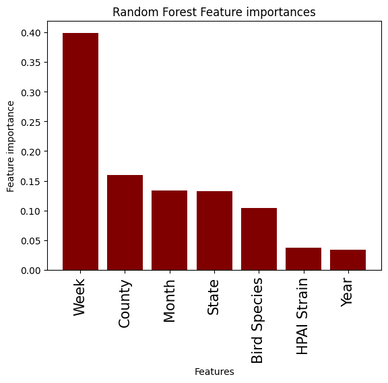
In this Google Collab Notebook, I collaborated with Ankur Roy to create three machine learning models that predict avian flu epidemics. We used support vector machines classifier, random forest classifier, and logistic regression on a dataset containing positive avian flu detections in wild birds. Our models accurately predict whether a new case will be part of an epidemic and identify the features that are most important for the prediction. The three models largely agree with each other, though they each have different accuracy metrics. The notebook automatically pulls the latest data with every run, ensuring that the information is as up to date as possible. The results of the analysis agrees with the prevailing idea of a strong seasonality and regionality effect in avian flu epidemics.
In this Google Collab Notebook, I collaborated with Ankur Roy to create three machine learning models that predict avian flu epidemics. We used support vector machines classifier, random forest classifier, and logistic regression on a dataset containing positive avian flu detections in wild birds. Our models accurately predict whether a new case will be part of an epidemic and identify the features that are most important for the prediction. The three models largely agree with each other, though they each have different accuracy metrics. The notebook automatically pulls the latest data with every run, ensuring that the information is as up to date as possible. The results of the analysis agrees with the prevailing idea of a strong seasonality and regionality effect in avian flu epidemics.
|
|
Image Analysis in Machine Learning Tutorial for DataCamp
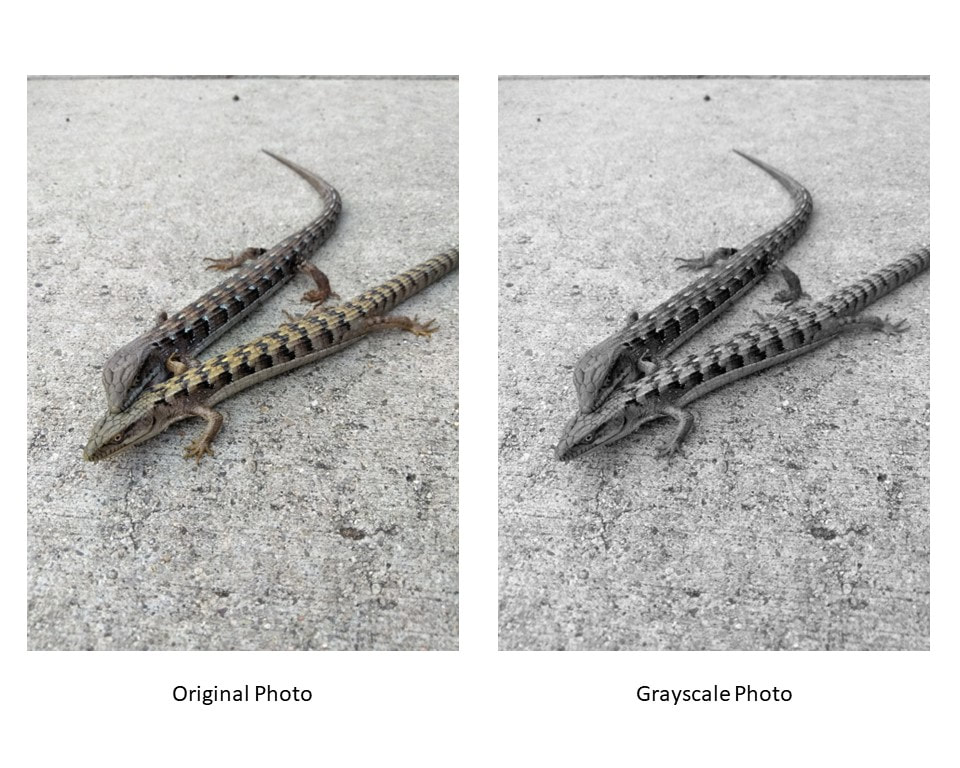
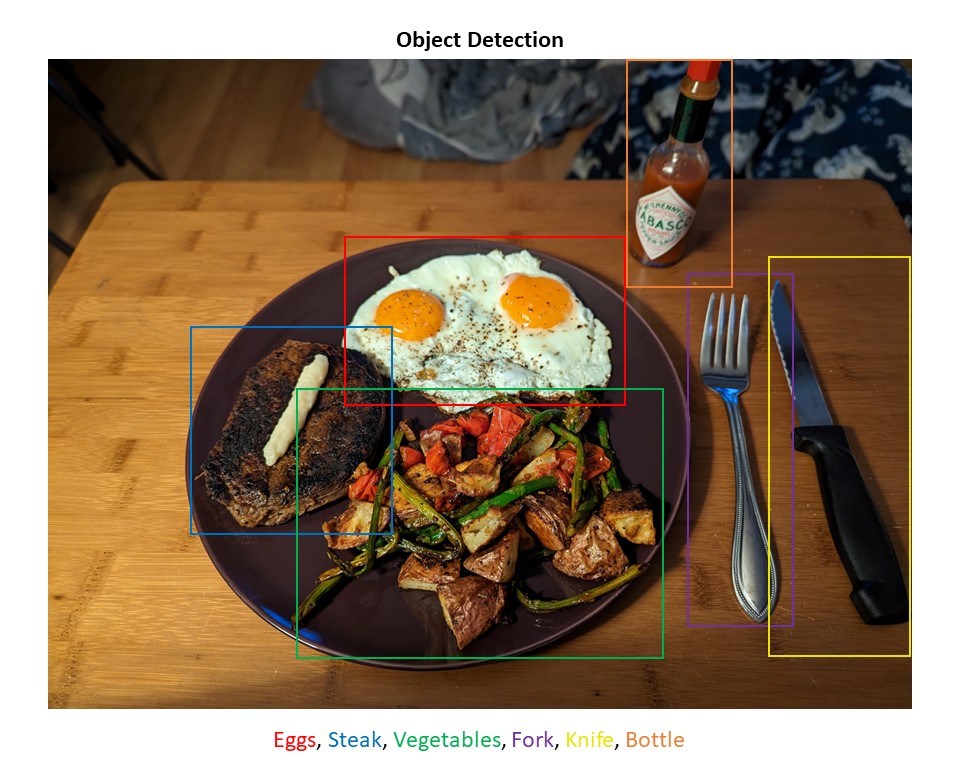
I had the fantastic opportunity to write an image analysis tutorial for DataCamp. This tutorial goes over image analysis and machine learning at a high level. It draws on my experience of over a decade working on image analysis in an academic setting. Every image in this tutorial was created by myself or generated using DALL-E.
I had the fantastic opportunity to write an image analysis tutorial for DataCamp. This tutorial goes over image analysis and machine learning at a high level. It draws on my experience of over a decade working on image analysis in an academic setting. Every image in this tutorial was created by myself or generated using DALL-E.
|
|
NFL Big Data Bowl 2023 - Python
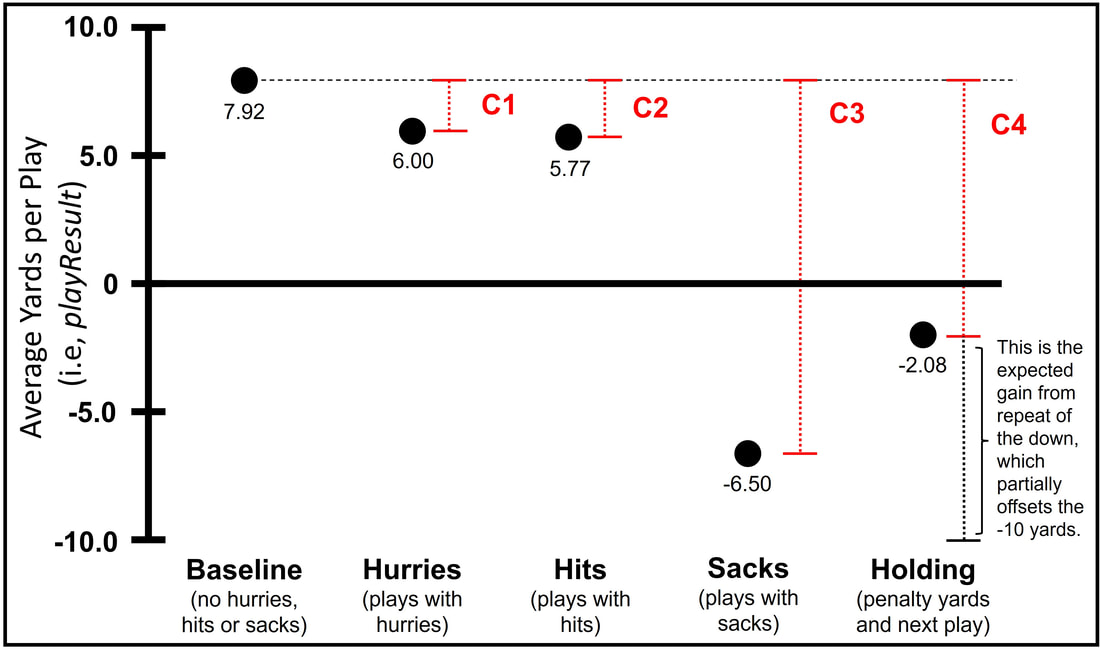
I worked with the fantastic Ashley Carter to create a new statistic to evaluate the performance of offensive linemen. We used weighted proportions of hurries, hits, and sacks allowed by each offensive lineman, along with holding penalties called on each of them to calculate our Pass Blocker Rating. We weighted each of these factors by the relative number of yards lost on average. We calculated the Pass Blocker Rating for each lineman in the 2021 dataset and examined our highest and lowest ranking players to determine the efficacy of our statistic. Our top three players included the highest paid guard (from their 2018 contract), and two pro bowl players. Our lowest scoring players included lineman who had been injured, let go, or switched positions.
I worked with the fantastic Ashley Carter to create a new statistic to evaluate the performance of offensive linemen. We used weighted proportions of hurries, hits, and sacks allowed by each offensive lineman, along with holding penalties called on each of them to calculate our Pass Blocker Rating. We weighted each of these factors by the relative number of yards lost on average. We calculated the Pass Blocker Rating for each lineman in the 2021 dataset and examined our highest and lowest ranking players to determine the efficacy of our statistic. Our top three players included the highest paid guard (from their 2018 contract), and two pro bowl players. Our lowest scoring players included lineman who had been injured, let go, or switched positions.

Medical Coding Practice Logistic Regression - Python
This is a coding assessment I completed where I parsed the data and ran a machine learning model to determine the likelihood of readmission of a patient within 30 days after they've had coronary artery bypass surgery. The data used is randomly generated using ICD-9 procedure/diagnosis codes.
This is a coding assessment I completed where I parsed the data and ran a machine learning model to determine the likelihood of readmission of a patient within 30 days after they've had coronary artery bypass surgery. The data used is randomly generated using ICD-9 procedure/diagnosis codes.
Pressure Trace Acquisition Using a DAQ - MATLAB
This program reads continuous data from a set of eight piezoelectric pressure sensors hooked up to a NI DAQ. It then converts the resulting voltage into pascals and creates two figures, one with the raw voltages and one with the converted pascals. This function uses a built-in dq function and requires the NI DAQ toolbox to run.
This program reads continuous data from a set of eight piezoelectric pressure sensors hooked up to a NI DAQ. It then converts the resulting voltage into pascals and creates two figures, one with the raw voltages and one with the converted pascals. This function uses a built-in dq function and requires the NI DAQ toolbox to run.
Identifying Worm Burrows - MATLAB
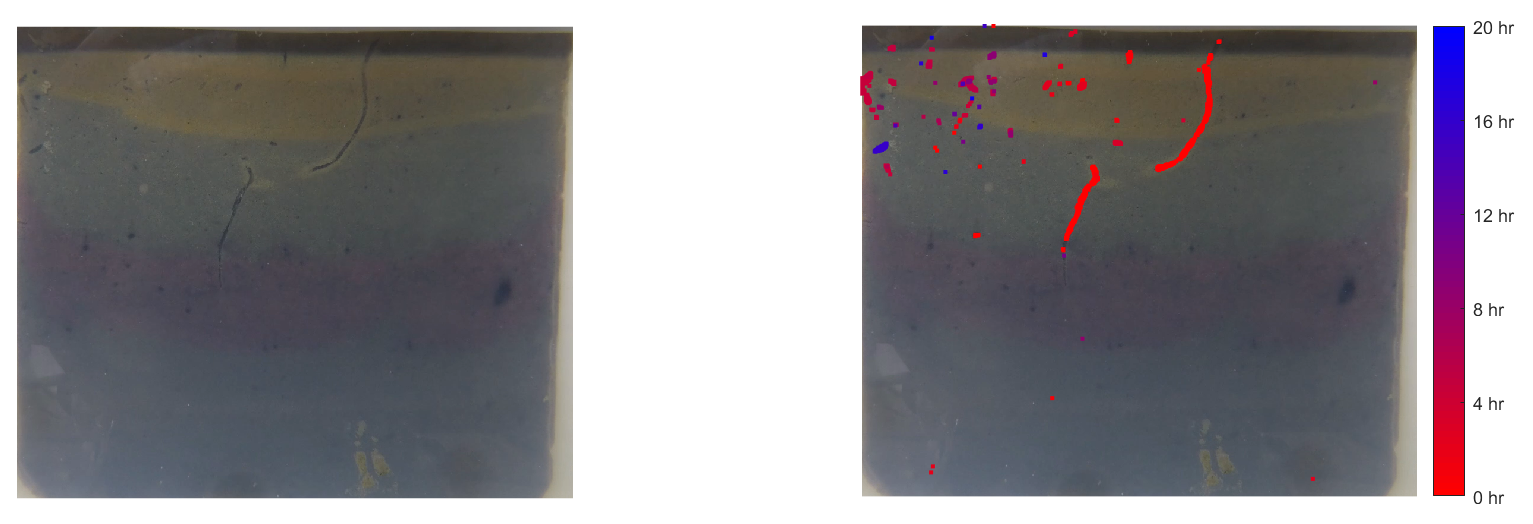
I created this program to find narrow worm burrows in thin aquaria filled with mud. This program takes in a timelapse video, looks for differences between frames, and determines the coordinates of the burrow that are created over time. It then generates a color gradient overlay to display when each section of burrow was found in the video. This is one component of a larger analysis of burrowing rate.
I created this program to find narrow worm burrows in thin aquaria filled with mud. This program takes in a timelapse video, looks for differences between frames, and determines the coordinates of the burrow that are created over time. It then generates a color gradient overlay to display when each section of burrow was found in the video. This is one component of a larger analysis of burrowing rate.
Analyzing Fish Schooling Behaviors - MATLAB
This set of code collects video and performs image processing on the videos. The analysis finds fish and analyzes their schooling performance under different lighting conditions. This was built in collaboration with Matthew McHenry and Alberto Soto and was used in the data analysis for our peer-reviewed publication on the sensory bases of schooling. That publication can be viewed here.
This set of code collects video and performs image processing on the videos. The analysis finds fish and analyzes their schooling performance under different lighting conditions. This was built in collaboration with Matthew McHenry and Alberto Soto and was used in the data analysis for our peer-reviewed publication on the sensory bases of schooling. That publication can be viewed here.
Larval Feeding Model - R
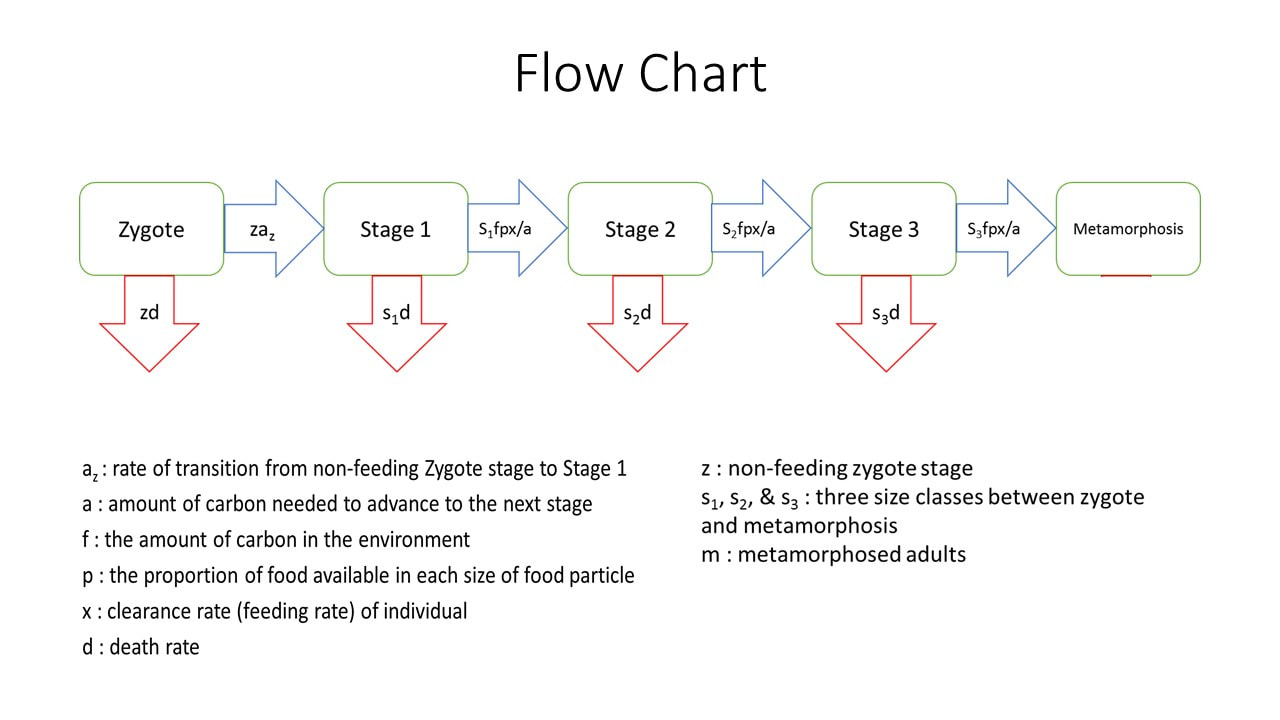
I used experimental data on feeding rates to model the metamorphosis rates of marine larval invertebrates with different feeding techniques. This model puts a population of 100 individuals of each of two feeding types into environments with different distributions of food sizes. It then follows the population to see how many make it through the four stages of growth to metamorphosis. This kaggle notebook is a modification of a model I made in undergrad in 2013.
I used experimental data on feeding rates to model the metamorphosis rates of marine larval invertebrates with different feeding techniques. This model puts a population of 100 individuals of each of two feeding types into environments with different distributions of food sizes. It then follows the population to see how many make it through the four stages of growth to metamorphosis. This kaggle notebook is a modification of a model I made in undergrad in 2013.
Datacamp tutorials
19. Mckee, A., 2024. What Is a Data Federation? DataCamp Tutorials LINK
18. Mckee, A., 2024. What Is a Data Mesh? DataCamp Tutorials LINK
17. McKee, A., 2024. What Is Data Lineage? DataCamp Tutorials LINK
16. McKee, A., 2024. What Is Data Fabric? DataCamp Tutorials LINK
15. McKee, A., 2024. Snscrape Tutorial: How to Scrape Social Media with Python. DataCamp Tutorials LINK
14. McKee, A., 2024. Python Absolute Value: A Quick Tutorial. DataCamp Tutorials LINK
13. McKee, A., 2024. Exploring Matplotlib Inline: A Quick Tutorial. DataCamp Tutorials LINK
12. McKee, A., 2024. How to Exit Python: A Quick Tutorial. DataCamp Tutorials LINK
11. McKee, A., 2024. Coding Best Practices and Guidelines for Better Code. DataCamp Tutorials LINK
10. McKee, A., 2024. Data Sets and Where to Find Them: Navigating the Landscape of Information. DataCamp Tutorials LINK
9. McKee, A., 2024. A Beginner’s Guide to Data Cleaning in Python. DataCamp Tutorials LINK
8. McKee, A., 2024. Exploring the Python 'Not Equal' Operator. DataCamp Tutorials LINK
7. McKee, A., 2024. Finding the Size of a DataFrame in Python. DataCamp Tutorials LINK
6. McKee, A., 2024. How to Delete a File in Python. DataCamp Tutorials LINK
5. McKee, A., 2023. Mastering Shiny for Python: A Beginner’s Guide to Building Interactive Web Applications. DataCamp Tutorials LINK
4. McKee, A., 2023. Functional Programming vs Object-Oriented Programming in Data Analysis. DataCamp Tutorials LINK
3. McKee, A., 2023. An Introduction to Data Pipelines for Aspiring Data Professionals. DataCamp Tutorials LINK
2. McKee, A., 2023. A Data Scientist's Guide to Signal Processing. DataCamp Tutorials LINK
1. McKee, A., 2023. Seeing Like a Machine: A Beginner's Guide to Image Analysis in Machine Learning. DataCamp Tutorials LINK
